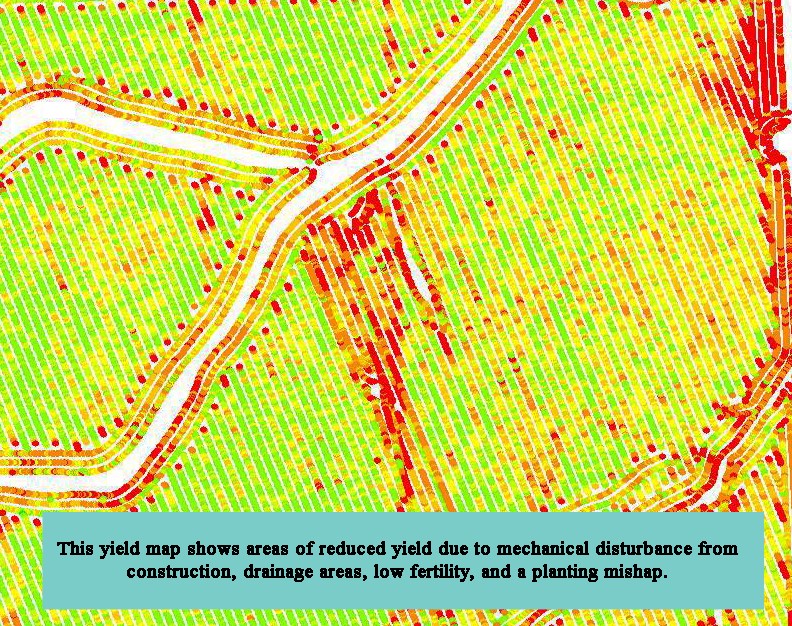
Many producers already use technology in their fields. Whether it is variable rate fertilizer based on grid soil samples, a yield monitor during harvest, or using different planting rates in your dryland corners than under your pivot, there are benefits to having a computer help with the field work.
The question I’ll approach here is: what do I do with my yield map?
First, when I get the raw data from your combine, it comes in dots that line up in order in which you harvested your fields. They have different colors for variable levels of yield, which I can manipulate. And they usually come with all sorts of extra numbers you usually don’t think about looking at, such as date, fuel efficiency, time logged in the field, and area covered. Once the data are on my screen, I can see when you forgot to stop recording as you turned around in your field, paused to unload into a grain cart, or inadvertently turned on the recording at the shop, and there’s a trail of red dots on the road that shouldn’t be there. I can take all these “oopsies” out so they don’t skew your results.

Do you have a low spot in your field, an area that seems to look better than everywhere else, only part of the field irrigated, or a sandy spot? Looking at these areas and separating out their yield will give you an idea of how the yield changes, allowing us to treat it accordingly to maximize your profits.
Did you variable rate your fertilizer, and want to see if it made a difference? We can compare the VRT map with your yields to assure the correct recommendations were made.
Did you use several different varieties in the same field? We can see which one did better and talk about why that may be.
Did last year’s corn do better than this year? I can compare years of data with each other, or use the history to analyze that funny spot in cooler, wetter, drier, or hotter weather, or a change in planting timing.
I can compare your yield to soil type or slope. Often yields differ on side slopes than the top of the hill or on bottom ground—even within one field. A sandy spot will leach water and nutrients quickly, which can affect crop nutrient uptake and yield. Steeper slopes have a chance for increased erosion, and that can create an opportunity to alter the way we farm it.
Beyond making a pretty picture, a yield map can tell us so much about your field. Pair that with smart soil sampling, variable rate planting and fertilization, and perhaps scanning your corn to create personalized nitrogen recommendations for split applications, and you’re on your way to maximizing profits, optimizing use of resources, and improved environmental impact.
